Snapshot of how we live in Oldham
Date published: 30 August 2011

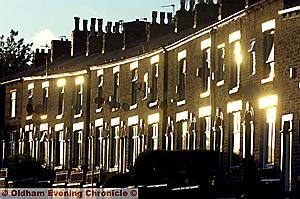
Terraced housing makes up just under half the borough's stock.
UNOFFICIAL figures have been released to give an indication of what the 2010 Census might reveal about Oldham.
The official census statistics won’t be available until mid-2012, but these estimated figures, provided by OldhamInfo, give an early insight into everyday life in Oldham.
OldhamInfo is a website created by the Oldham Partnership — made up of public and private-sector groups — which is designed to make statistics and local information more easily accessible.
The figures provide data on housing, employment, ethnicity and transport to name just a few.
Particular attention will be paid to the economic figures as they offer a glimpse into Oldham’s reaction to the recession.
Here are some of the most interesting figures.
Ethnicity:
White: 82.52%
Asian: 14.18%
Mixed: 1.54%
Black: 1.11%
Other: 0.64%
Housing
Terraced housing: 46.17%
Semi-detached: 31.24%
Flat: 11.95%
Detached: 10.63%
Lone Parent households: 13.39%
Household tenure:
Owner occupied: 73.30%
Social rented: 19%
Private tenant: 4.83%
Means of travelling to work:
Car:59.99%
Foot: 10.03%
Work at home: 8.08%
Minibus/coach: 7.89%
Train: 1.56%
Bike: 1.21%
Economic Activity:
Employee: 82.46%
Economically active: 69.87%
Economically inactive: 30.13%
Unemployed: 7.52%
Self-employed: 7.19%
Full-time students: 2.84%
Most Viewed News Stories
- 1The Oldhamers handed awards in King’s New Year’s Honours List
- 2You can score free tickets to a Latics game while supporting Dr Kershaw’s Hospice
- 3Primary school in Uppermill considers introducing new ‘faith-based’ entry criteria to tackle...
- 4Public inquiry announced into rail upgrade that could leave villages ‘cut off’ for months
- 5Tributes paid following death of hugely respected Oldham community figure Dale Harris


